- Americas
- Asia Pacific
- Europe
- Middle East and Africa

2023 insolvency statistics
Trends, challenges and business resilience in 2024

While the economy may have (barely) avoided recession in 2023, the cost-of-living crisis has had a severe impact on businesses, especially for small and medium enterprises (SMEs).
Over the last two years the Producer Price Index (a measure of the cost of goods for businesses) is 13% up, average wage costs have increased over 10% and the Bank of England base rate has risen 5 percentage points. At the same time, consumers are also being squeezed and looking to reduce their discretionary spending. Since December 2021, food costs have increased 26%, rent costs are up 10.7% and gas prices are 58% higher (source: ONS and Bank of England).
This leaves businesses squeezed in the middle with lower revenues, higher operating costs, and higher costs of finance.
There are parallels between the pressures suffered over the last few years and the 1990s recession. We can follow these trends to predict what we may see in 2024.
2023 insolvency statistics

Source: Insolvency Service
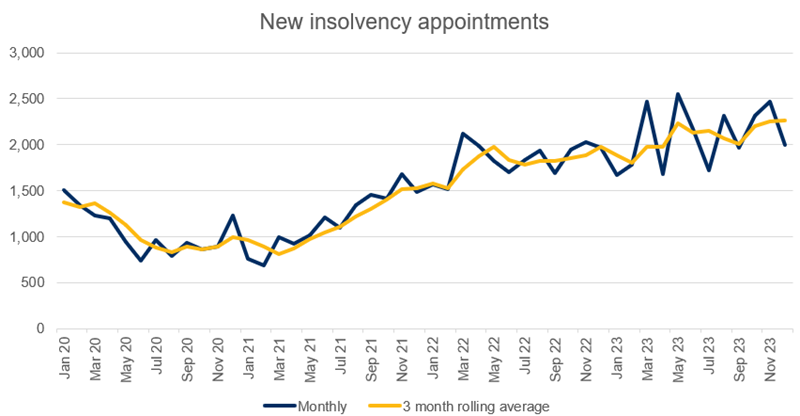
When viewed month by month, 2023 has been far more volatile than recent history. Intermonth swings in new insolvency appointments were regularly over 30% up or down over the course of the year.
When we look at the period from 2020 through to today, based on a rolling three-month average to smooth out the extreme peaks and troughs, what becomes clear is that the high rate of insolvency appointments experienced in 2023 is the continuation of a longer trend.
Since the withdrawal of most COVID-19 support measures in the first half of 2021, the number of new insolvency appointments has been rising. Rapid increases through 2021 saw the average monthly rate of new insolvencies increase from the historic low of 814 in Q1 2021, to surpass the 2019 pre-pandemic level of 1,431 by Q3 2021 (avg. 1,513) and it has continued rising since.
Although the rate of increase has slowed over the last 18 months, if this trend stabilises, it would still be at a level rarely observed outside of the most severe recessions the UK has faced in the last three decades.
Industry sectors
Across all industries in England and Wales there was an average of 101.6 appointments per 10,000 registered entities. However, some industries took substantially more of the pain than others.
| Industry | Appointments per 10,000 |
| Hospitality | 239.8 |
| Manufacturing | 162.4 |
| Construction | 126.9 |
|
Retail |
107.3 |
| All Industries | 101.6 |
Source: Insolvency Service and ONS
Given the cost-of-living crisis, the hospitality and leisure sector had the highest rate of appointments compared to the number of entities active in the sector. Being entirely reliant on discretionary spending, with relatively large, fixed overheads and high energy usage, the sector has been one of the worst hit by the current economic downturn.
Lower demand and higher input prices have also driven a high level of insolvency appointments in the manufacturing sector as margins are squeezed. As well as operating costs, the sector often relies on financing of critical machinery and equipment, while rates may be fixed for the term of the agreement, any renewals will reflect the current higher base rate.
Interestingly, the retail sector appears to have weathered the storm better in terms of insolvency statistics. However, whilst companies may not have been entering into insolvency processes, the pressures have still taken a toll. More than 10,000 stores permanently locked their doors in 2023, with around 120,000 job losses.
Historical precedent
In absolute terms, 2023 saw a thirty year high of new insolvency appointments. The 25,160 appointments were the second highest since the 1986 insolvency legislation was introduced, exceeded only by 26,316 appointments in 1993.
As might be expected, there is a close association between the rate of inflation and corporate insolvency appointments. When inflation increases, consumers become more cautious with spending money, reducing demand for goods and services. At the same time, businesses face cost pressures due to wage demands from staff and higher cost of goods. The resulting squeeze on margin and available cash flow leads to business failures.

Source: Insolvency Service and ONS
If we look at the trends over the last thirty years, the early 1990’s recession and the Financial Crisis in 2008-09 are clearly identifiable peaks in insolvency appointments.
The more recent of these, the Financial Crisis in the late 2000s, was characterised by a lack of confidence in financial institutions. The market reaction caused plummeting stock prices, bank bail outs and a credit crunch. Whilst inflation peaked at 4.5% during the crisis the lack of liquidity and available debt was a much more substantial driver of insolvency processes. Business failures were not being directly driven by lack of demand or increases in operational cost.
The use of administration appointments, a process structured more towards rescue or sale of trading assets, peaked during this period with over one in five insolvency appointments being administrations. In comparison, administrations were only one in 16 appointments during 2023. Whilst not definitive, the implication of the higher use of administration processes in the 2000s is that underlying operations of businesses were viable, and it was more likely to be over-leverage or a failure of financing structures that triggered the insolvency appointments.
By contrast, the record levels of new insolvency appointments in 2023 is being driven by Creditor Voluntary Liquidations (CVLs). The cost-of-living crisis and inflationary pressures faced by businesses over the last two to three years, are far more like the 1990’s recession than the financial crisis of 2008-09.
1990s vs 2020s
The business world has changed substantially since the 1990s with technology and the internet driving changes in work and consumer behaviours. However, the fundamentals of running a business remain the same and so parallels can be drawn between the two periods.

Source: ONS
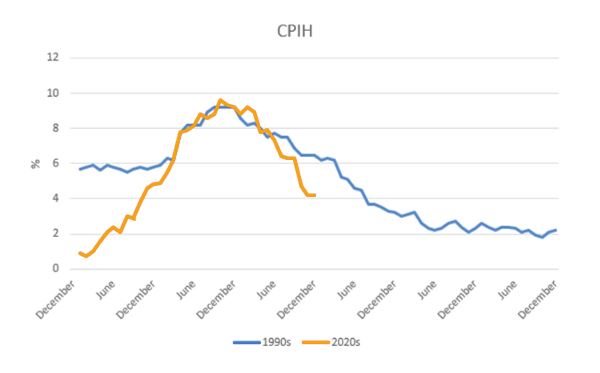
Aligning the 1990s recession (from Jan 1989 to Dec 1984) and the recent period starting in January 2020, there are marked similarities between the profile of the inflation peak.
Whilst inflation started at a far lower level of 0.9% in early 2021 compared to 5.7% in 1989, both have reached similar peaks and profiles through the second year and into the third. Forecasts for 2024 expect inflation to continue falling through the year albeit at a more moderate rate, potentially reaching 2.2% by Q4 2024.
Inflation is tapering slightly quicker today than it did back in the 1990s which will be welcome news for many businesses, although we must remember that lower inflation simply means that the cost is rising at a slower rate. However, whilst operating cost pressures are starting to stabilise, financial cost pressure remains high.
In contrast to the approach taken in the 1990s, the Bank of England has substantially increased the base rate throughout 2022 and 2023 despite falling inflation. This has increased the cost of borrowing and is an additional cash drain on businesses already struggling to meet operational pressures. We cannot forget that surviving the COVID-19 period has forced many businesses to take on additional debt and utilise reserves which otherwise may have enabled them to better ride out the recent storm.
Insolvency appointments

Source: Insolvency Service
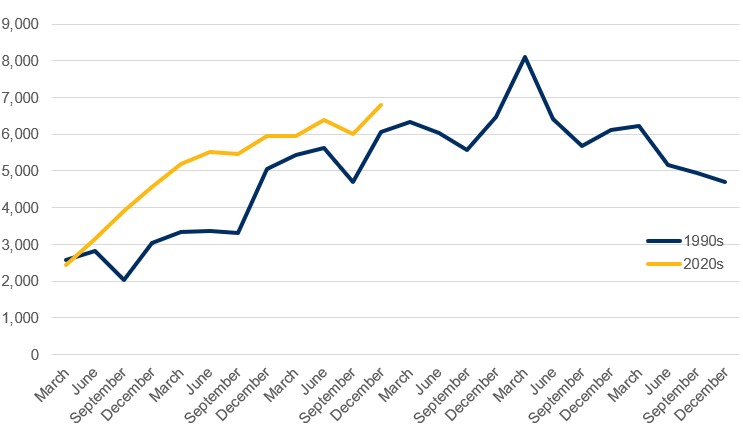
As we can see in the graph of insolvency appointments over the last 30 years, the peak rate of insolvency appointments often lags the peak in inflation. In the 1990s recession, the high rate of insolvency appointments continued for several years and didn’t peak until Q1 1993 – equivalent to Q1 2025 if mapped onto the chart above.
While inflationary pressures are starting to ease, the cost of debt remains high compared to recent history. Moreover, in the aftermath of COVID-19, many businesses find themselves without sufficient reserves to endure periods of econimic downturn. The similarities between current economic factors and those of the early 1990s suggests that 2024 and early 2025 are likely to remain challenging for businesses, with heightened activity expected in the restructuring and insolvency space.
While 2023 registered the highest level of new insolvency appointments in thirty years, it is likely that things could get even worse.
Please contact our Recovery Solutions team or your usual Crowe contact for more information.
